Leeds Public Health Dashboard
Produced by: Rob Harrand
Find out more: Website
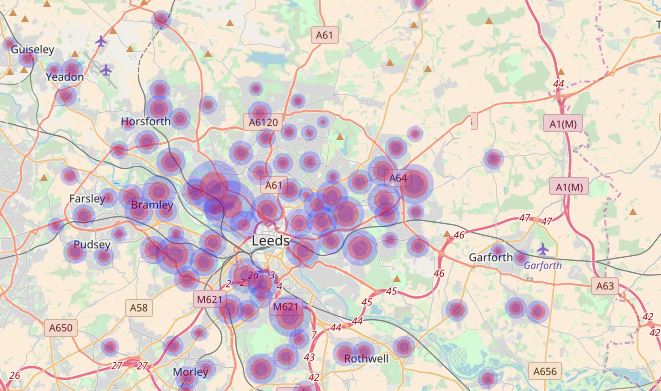
The Leeds Public Health Dashboard provides the user with an interactive tool to easily view information about a variety of health-related factors affecting the city. Just choose your preferred indicators and click on ‘Display Points’ to see the results plotted on the map.
The Dashboard uses information extracted from the Data Mill North to create interactive maps based on two health-related statistical indices for Leeds City and the localities within the council area: Mortality Rates and Disease Rates.
Mortality Rates are based on factors including cancer and circulatory-related deaths. The date range available covers the years 2006-2015 and can be plotted so as to show Male / Female / Overall rates.
Disease Rates include indicators such as pulmonary disease, diabetes, obesity and heart disease. The date range available covers the years 2012-2016
For more information about this product please contact Rob Harrand