Data for people who don’t do data
Written by: Sandip Ghattaure, Data Mill North, 27/05/2016
Chances are if you’re reading this you have an interest in data. Whether it be looking for patterns or re-using it in different ways. If however, you want to find out more about the city and don’t have a background in analysis or coding, or just simply not interested in looking at rows and rows of data, then maybe the Leeds City Dashboard is for you.
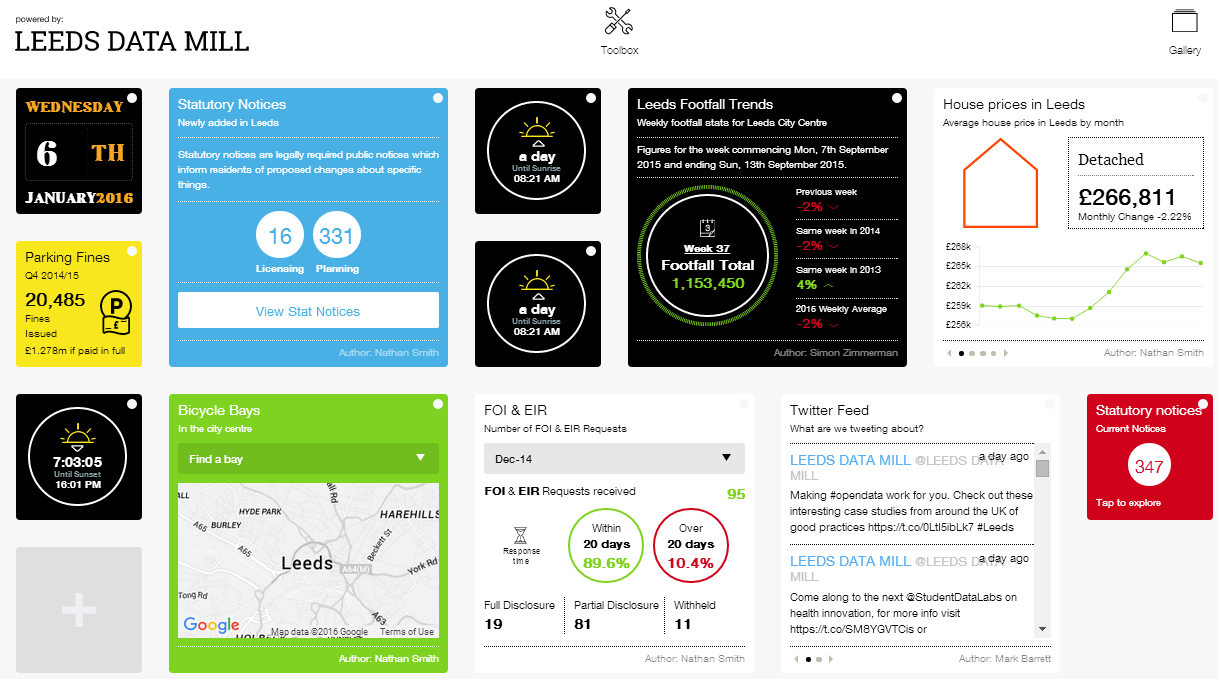
Developed by Leeds City Council and Hebe Works, Leeds City Dashboard takes open data from Leeds Data Mill and other sources and presents it in a user friendly, easy to understand way. Dashboard ‘Stories’ include air quality trends, live events feeds and planning notices to name but a few. You can even upload your favourite Twitter feeds or videos from YouTube. The data is presented in a variety of ways such point location maps, heat maps and graphs.
Prefer to see different Stories on the Dashboard? It’s easy! Create your own Dashboards or even create several dashboards to suit your needs and tastes – one for work and one for home? With lots of stories to choose from there really is something for everyone.
Is there a Story you would like to see visualised? Let us know at [email protected]!
Do you have the technical skills to create your own Story? Well, have a go – the documentation can be found here on GitHub.