Hack My Route – Live Blog
Written by: Data Mill North, 07/02/2015
Leeds Data Mill have joined forces with West Yorkshire Combined Authority (formerly Metro), and ODI Leeds to create Hack My Route, a creative hack day designed to bring cyclists together with road safety specialists and creative developers to create a new service for cyclists across the wider West Yorkshire region. Catch the action as it unfolds here!
9.31am The kettle is on!
We’ve got the kettle on, the biscuits ready and our first few hackers are starting to arrive, some of them have stayed on topic and cycled in :)
10.10am How to prototype
Getting some inspiration from ODI with their handy ‘what is a prototype’ video.
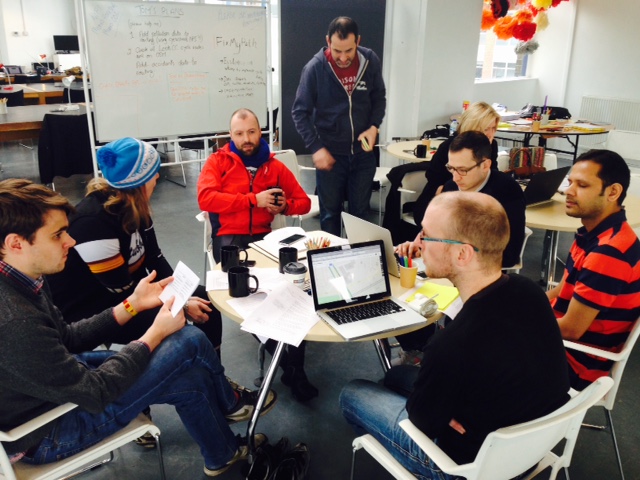
11.30am Initital ideas
A quick update from the team on their initial thoughts and ideas responding to the challenge and exploring the data. Ideas to be worked up this afternoon are:
- Fix My Path
http://github.com/nikolai-b/hackmyroute
Using cycle to work census data and predicting propensity to cycle distances based on age, gender, lifestyle this service will predict where there is most likelihood of increasing cycling and therefore which routes should be invested in and upgraded and where there should be new routes created. Used as an aid to inform government spending on infrastructure. - Polution Data Mapping
Taking the 8 pollution data points and mapping these on to the Cycle Streets API to prove that layering additional data sets onto this API can change the routing advice. - Colour-coding routes according to ability
Allowing users to upload routes based on ability – implementing a ski route system colour coding the routes for age, weight, ability, calculated by users entering these details. - Feedback from both sides
A system where all sides can feedback to make the routes safer not just cyclists. Gathering views and reports from bus drivers, motorists, pedestrians and cyclists.
12.30pm A bit of R&R
Heading in to lunch time with Chapiteau Massage helping our hackers to rest, refresh and refuel before the last push this afternoon.
4.30pm The big reveal
Group 1: If we want more people to cycle infrastructure plays a huge role in that so they created a policy planning tool. Unusually this tool is accessible to the public to allow for a real time feedback loop adding to the decision making process. The idea includes a layer to show where most cycling currently takes place and can compare and contrast between wards/areas. Users can filter and add layers such as pollution data to start to analyse what other factors might impact on cyclist numbers in that area. Uses data sests including where the cycle parks are, air quality data, Leeds cycling routes, and road traffic accident data. The service can also pick out the fastests, the shortest and safest routes so bike paths can be measured by a number of different factors.
Go and play with is at: http://robinlovelace.shinyapps.io/fixmypath/
Group 2: Incorporating data into a routing algorithm to identify the cleanest not just the quietest routes to give a score to how much Nitrogen Dioxide cyclists might breathe in on a journey – this is a starting point for that which is quite ambitious. User can find a route and depending on areas of high polution they can switch to a cleaner route. The purpose of this hack was to prove a use case for releasing more of the air quality data. There are more than 80 monitoring stations in Leeds and the team behind this hack believe that this proves the case for data release from all of them.
Go see it at: http://cleanestroute.webmostermedia.co.uk
Group 3: Creating an app called Route Rater / Rate My Route. How can we create a simple method for users to share their route and give a ratings? Could include a mapping interface that would allow cyclists to add feedback and ‘events’ to their routes e.g., a nice view, a great place to stop whilst en route. When at their destination cyclists can rate their route, as opposed to sticking to the ‘official’ routes this would be a web app or website that could map where people cycle in Leeds as opposed to official cycle routes. The service would inlcude a ‘ski route’ style colour coding for the routes*. Uses open street map data and sarts with a simple base of rules e.g., all A roads are red but after the user base is built this might be changed to green or blue based on feedback. Future iterations can take into account personal information to help cater for audiences e.g., a 45 year old male of healthy weight might find a route easier than an elderly male, slightly over weight male. Would need to have a personal data capture element. Essentially a user-generated Leeds city cycle map without having to do any typing, all tick box options so very intuitive and easy to use.
*Extra points awarded to group three for excellent use of pipe cleaners.
5.30pm We got ourselves a winner…
Group 3 will be receiving £4,500 of development funding working closely with West Yorkshire Combined Authority to turn their idea into a reality with a six week residency at ODI Leeds.
Not all boo hoo for groups 1 and 2 though as there are a couple of other projects at WYCA which might be interested in their ideas – everyone’s a winner really!