How qualified is Leeds? I decided to create some maps…
Written by: Sanne Velthuis, Joseph Rowntree Foundation, 03/06/2014
I know very little about Open Data. In fact, until a few months ago I had only a very limited understanding of what exactly was meant by the term – apart from a vague notion that it probably had something to do with things like Wikipedia and Linux. I have a bit of knowledge, if still not a lot, about data analysis, and I know virtually nothing about coding. Nonetheless, in April I took part in the National Hack the Government event in Leeds, interested to learn more about Open Data and the Leeds Data Mill.
I was part of a group that decided to focus on the Data Challenge about increasing the levels of skill and employability in Leeds. Due to the time constraints and influenced by the interests of the team members we decided to try and create a practical app for people to use when looking for a new job. Despite our team not quite finishing the app, the two days were really good fun and I came away with a slightly improved understanding of how programming works.
I also left the event wanting to find out more about how to use openly available government data in creative ways. I was particularly excited about some of the interesting maps that were featured during the event. They reminded me of the cool maps shared by @Amazing_Maps on Twitter, or the innovative maps made by people like Danny Dorling, some of which are shown on his WorldMapper.
I decided to try my hand at creating some maps myself. Inspired by the Data Challenge, I was interested to see if I could make a map showing skills levels across Leeds. Although Leeds is a city with a large number of highly skilled people – partly due to the presence of two leading universities, as well as a number of further education colleges – there are also parts of the city where people are not as highly qualified. If Leeds is to raise its skills profile and therefore the employability of its population, I felt it would be particularly useful to know what areas of the city have relatively lower average qualification levels. I figured that way education and training opportunities could be better targeted at those who lack good formal qualifications. Also, having a better understanding of skills disparities across the city could assist efforts to help people access suitable employment which is commensurate with their skill level.
So I set to work. To create my map I decided to use the open source Geographic Information Systems application QGIS. I was able to find a shapefile for all LSOAs in England and Wales on the Office of National Statistics Geoportal. Information on qualification levels across Lower Layer Super Output Areas is available in the 2011 Census for England and Wales, datasets from which can be retrieved from NOMIS (see this post by Steve Peters for more info on how to use NOMIS’s Advanced Query wizard, although instead of using an API I simply downloaded the data as a .csv file). With just these two components I managed to create, after two days of trial and error and with the help of a few online tutorials, a series of simple maps showing the percentage of the working-age population in each area by highest level of qualification attained.
As the maps clearly show, there is a large variation in the distribution of qualifications across the Leeds area. Although the proportion of working-age individuals with Level 1 qualifications (1-4 GCSEs) and Level 2 qualifications (5+ GCSEs at grades A-C) is fairly even across the city, those without any formal qualifications appear to be predominantly concentrated in certain areas of south and east Leeds (for a more detailed list of which qualifications are included in each level see here). Conversely, those with Level 4 qualifications (degree level and above) are predominantly located in areas of north Leeds.
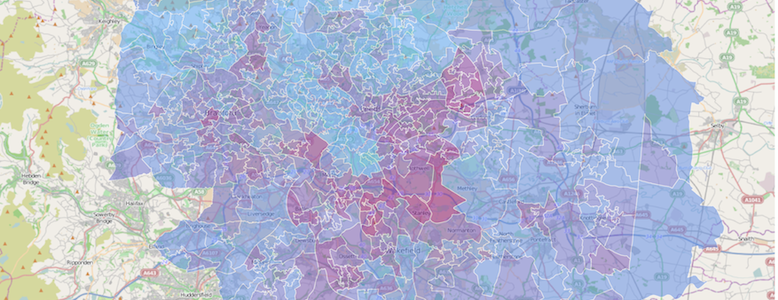
To show more clearly the location of the different super output areas, I added an OpenStreetMap background layer using the OpenLayer plugin. On the resulting map below you can see more clearly the distribution of working age people with no qualifications. Across Leeds, 15.7 per cent of the working population is without qualifications, a bit higher than the average for England and Wales at 14.6 per cent. Among 16 to 24 year olds though, the percentage is much lower, at only 8.8 per cent. In this respect Leeds is doing substantially better than across England and Wales on average, where the percentage is 10.9.
However, as shown in the map below, in certain areas of Leeds the levels of 16 to 24 year olds without qualifications are much higher, in some super output areas reaching up to 30 per cent. In these neighbourhoods there is clearly more work to do to ensure that young people do better in school by having the right kind of support and quality teaching.
By linking this data with information on other characteristics of these areas and the people living in them, we could potentially find out a lot more about the relationship between, for instance, skills and employment levels, or between qualifications and earnings in different areas of the city. I’m hoping that over the next few months I will be able to explore some of these links using my new-found data skills!
—
Blog post by
Sanne Velthuis (@sanne_velthuis)
Sanne is currently an intern at the Joseph Rowntree Foundation, and is interested in local and regional inequalities in employment, education and poverty