The importance of blending local and national data sources
Written by: Steve Peters, DCLG, 15/04/2014
Platforms such as Leeds Data Mill, Greater Manchester Data Synchronisation Programme, and the Hampshire Hub share a common (golden) thread and bigger prize: They set standards to blend data from local and national sources. This is key to enabling innovative new data-driven tools and insights, focussed around places, people and communities.
I thought I’d try practicing what I preach, by demonstrating how to join-up some of this lovely new local data with related third-party, national sources. So, I’ve built a quick demonstration which blends postcode-sector level data from Leeds City Council on tenanted properties, with data from the 2011 Census on the main occupation of householders in postcodes, in the Leeds area.

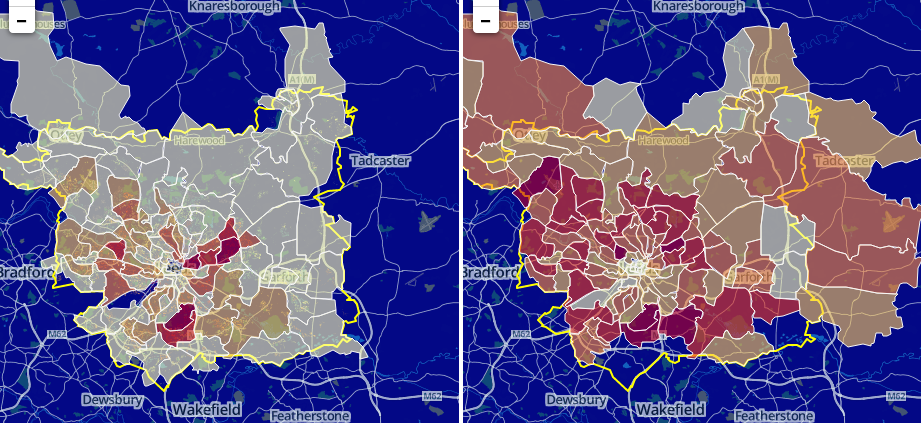
The map on the left shows concentrations of Leeds City Council’s current council housing with tenants at postcode sector-level: as published in this dataset. The map on the right shows numbers of people within each postcode sector, according to the occupation of the main householder. The underlying data comes from this Census 2011 output, and is retrieved in real-time from NOMIS.
Clicking on either map will present additional information about individual postcodes. For instance, the example below shows that Leeds City Council has 2,245 tenanted properties in postcode sector LS10 3: the pie chart indicates how this breaks-down by different types of property. Using the map on the right, we can see (from Census 2011) that the same postcode sector has 12,676 people – with the pie chart indicating how this breaks down across the householder’s main occupation.

Under the bonnet: how it works
Firstly, none of this would be possible without open data. I’m using various products, from various organisations. My thanks for taking the time and trouble to create open, re-usable outputs go to:
- Ordnance Survey, for BoundaryLine (which I use for the Leeds City Council boundary) and CodePoint-Open – used by GeoLytix to generate postcode sector boundaries.
- Geolytix, for the postcode sector boundaries.
- OpenStreetMap – for the backdrop mapping.
- Office for National Statistics (and NOMIS) – for the Census 2011 outputs; and
- Last, but by no means least, Leeds City Council and the good folk at the Leeds Data Mill
I’ve also used a number of open source and free data publishing and visualisation tools, and am hugely grateful to the big brains at:
- Geoserver.org – for the open source software behind the postcode map layers.
- mapbox.com – for providing an excellent platform for me to style and publish OpenStreetMap backdrop mapping
- NOMIS, for providing a superb Restful API for me to quickly query and re-use Census 2011 outputs
- leaflet.js, for the wonderful javascript mapping library; and
- highcharts, for an amazing suite of on-line interactive charting widgets.
Roll your own data and maps
You’ll have spotted from my previous posts that I much prefer working with data via Restful APIs, ideally serving outputs as LinkedData via SPARQL endpoints. However, the reality is that this is not (yet) a universal approach and we’ll need to accommodate a mixture of file and API-based sources, in a variety of formats, for some time.
Like many other organisations, Leeds has chosen to provide the data on tenanted properties as a downloadable CSV file. I wanted a way of working directly with this – i.e. avoiding messy re-formatting – so I plumped for the jquery-csv parser.
Data from NOMIS can be queried directly, and retrieved in a range of formats via their excellent Restful API. This can take a little while to master, but is (I promise) well worth the effort.
I’ve found that the easiest way to learn is by constructing the required Restful URL using NOMIS’s advanced query wizard. To do that:
- Head over to NOMIS, and get yourself a free account.

- Once logged in, start the Advanced query wizard (via link in top right hand box of screen above), and pick your dataset.

- Next, pick the geographic areas and variables you want to retrieve from the selected dataset. In the example below, I’m choosing to get all Postcode Sectors within a selected set of postcode areas (which for Leeds, would be “LS” and possibly parts of the “WF” and “BD” areas). You can refine other variables using additional options in the left-hand menu of choices (see example screen below, noting that choices will be particular to the dataset you’ve chosen).

- Now the most important part. The links to get data from NOMIS’s Restful API. These links are available by choosing the “format / layout” option, then “View API links for this query”. This should lead you to a screen a bit like the one below.

- From here, its a simple case of copying then pasting the relevant link into your application code. So, to get a CSV file, copy the “Comma Separated Value” link.
- Other output formats are available by choosing “Show all available API formats and links”. I’m using the JSON format in the Leeds demonstrator. The link is:
https://www.nomisweb.co.uk/api/v01/dataset/NM_564_1.data.json?date=latest&geography=1157631685…1157631795&rural_urban=0&cell=0,1,10,18,23,30,35,43,49&measures=20100
Separate posts to follow on LinkedData. In the mean time, happy data mashing!
—
By Steve Peters – @Open_Data
